Basic Examples
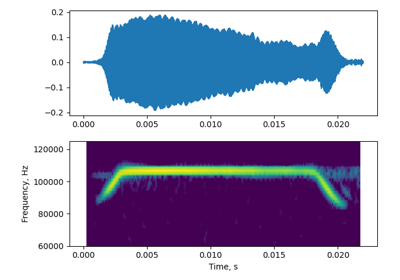
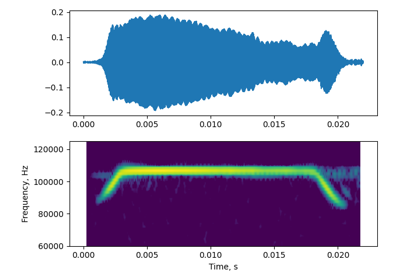
This is a set of relatively straightforward examples. Start with the bat call example! The bat example is the only one with all the plots already rendered due to RAM limitations - sorry about that! You can of course always download all the examples and run them as individual .py or Jupyter notebooks!
All of the frequency tracking in itsfm is based on generating what is called the Pseudo Wigner-Ville Distribution (PWVD). To get a very quick idea of how it compares to a spectrogram checkout the ‘Segmenting with the PWVD method’ example.


